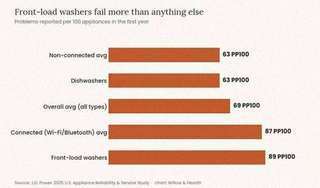
Thirty-two percent of homeowners dealt with an appliance breakdown in the past year, according to Hippo Insurance’s 2026 Housepower Report, making it the second most-reported home problem behind plumbing. That’s roughly one in three households replacing a part, calling a repair tech, or hauling a dead washer to the curb within any given twelve months. The number isn’t random noise, either: J.D. Power’s 2025 U.S. Appliance Reliability & Service Study found that front-load washers rack up 89 problems per 100 units in their first year, the worst of any category tested, while the average across all appliance types sits at 69 per 100. If your laundry room has let you down more than your kitchen, the data says you’re not imagining it.
Front-load washers are the weak link
J.D. Power’s study breaks failure rates into “problems per 100” (PP100): essentially, out of every 100 units sold, how many generated a service call or a functional complaint in year one. Front-load washers led at 89 PP100. Dishwashers came in at 63, tied with the average for non-connected appliances generally. The gap isn’t small: a front-load washer is roughly 40% more likely to need attention than a dishwasher in the same house. Front-load mechanisms deal with more moving parts under load: door seals, drum bearings, and drain pumps that all have to manage standing water in ways top-load machines mostly avoid.
Smart features add real failure risk, not just convenience
The more surprising finding in J.D. Power’s data is what happens when you add Wi-Fi or Bluetooth to any appliance category. Connected washers, dryers, dishwashers, refrigerators, and cooking appliances averaged 87 problems per 100 units, compared to 63 for the same categories without connectivity features. That’s not a small gap, and it held up specifically among people actively using the connected features, where the rate climbed to 92 PP100. A smart oven isn’t failing more because the oven part got worse; it’s failing more because there’s now a Wi-Fi module, a companion app, and a firmware update process layered on top of a machine that used to just heat up.
What breaking down actually costs
Repair costs vary widely by category. HomeAdvisor’s 2025 cost data puts the average appliance repair at $179, with a typical range of $108 to $251, but that average hides a lot of spread. Refrigerator repairs run $200 to $300. Washing machines can run anywhere from $50 to $450 depending on what fails. And the energy source matters more than people expect: gas-powered appliances cost roughly 20% more to repair than electric ones, since gas repairs often require a licensed technician for safety reasons that electric repairs don’t.
None of this means smart appliances or front-load washers are a bad buy. Front-load machines use less water and detergent per cycle, and a connected fridge that texts you about a failing compressor before it dies can save real money. But the reliability data suggests a trade-off that manufacturers don’t advertise loudly: every feature added to an appliance is one more thing that can fail independently of the core function you bought it for. A washer that just washes clothes has fewer failure points than one that also reports its cycle status to your phone.
What extends the life of what you already own
Most of the categories driving up the breakdown rate respond well to maintenance most owners skip. Front-load washers need their door gaskets wiped dry and their drums run on a hot cleaning cycle monthly, since standing moisture in the seal is exactly what breeds the mold and bearing wear that show up as service calls. Dishwashers last longer when the drain filter gets pulled and rinsed every few weeks instead of left to clog quietly. And on connected appliances specifically, keeping firmware updated matters more than it does on a phone: a stalled update can leave a smart control board in a state that reads as a hardware failure to a technician, turning a five-minute fix into a full board replacement. None of this eliminates the mechanical wear J.D. Power is measuring, but it pushes a given unit’s odds closer to the average than the worst-case number.
Put the two numbers side by side: a third of households hitting a breakdown this year, and specific categories running 30% above the field average. The pattern isn’t really about bad luck or bad brands. It’s that appliance reliability tracks mechanical complexity almost exactly, and complexity has been climbing steadily even in categories that don’t need it.
Leave a Reply